By Dr. Gyan Pathak
Only a few days ago on June 12, 2025, the Union Government released its inflation data based on Consumer Price Index (CPI) for May, 2025, and said that the year-on-year headline inflation of the country declined to 2.82 per cent (provisional) over May, 2024. It was lowest since February, 2019, when it was 2.58 per cent. Nevertheless, one thing is obvious that it does not reflect the backbreaking price rise, which the common men, especially the poor, are reeling under.
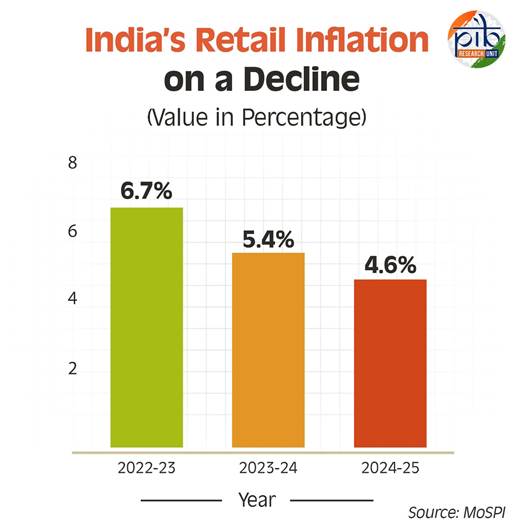
The yearly data of 2019 shows that inflation that year was at 3.5 per cent, despite the February 2019 inflation at 2.58 per cent, that the government referred, perhaps to mislead people about the real level of inflation. In 2017, headline inflation was 3.3 per cent, which rose to 6.7 per cent in 2020, 6.8 per cent in 2022, and came down to 5 per cent in 2025. Now in May 2025 it came down to 2.82 per cent. All these data show that during the entire period under PM Narendra Modi’s rule, inflation remained volatile. And who suffered this volatility most? The poorest.
Before going into the devastating impact of inflation on common people, that is hidden in the inflation data, just released by the government, few things must be taken into consideration first. PM Narendra Modi has just repeated the deception of India’s economic growth in Cyprus, by telling the world that India would soon become the third largest economy of the world.
There is yet another fact that 80 crore people in India are currently depending on Pradhan Mantri Garib Kalyan Ann Yojna for food. Sonia Gandhi of Congress has pointed out that another 14 crore people are being denied free food grains. The claim is based on non-availability of data, because Modi government has delayed the census, which would now be held by March 2027.
World Inequality Report 2022, said that top 10 per cent had earned 57 per cent of the national income. Top 1 per cent controlled 40 per cent of GDP. If we remove top 5 per cent controlling 62 per cent of GDP, the 95 per cent of the people in the country will come down to less than Rs 1 lakh yearly. It means, impact of the inflation is felt most by these people, but the inflation data conceals it. Additionally, it should be noted that in 2022-23, the bottom 50 per cent earned only an average of Rs 71,163 yearly. Sufferings of these people are not being reflected either in the boasting of the government about India in the way to becoming third largest economy of the world, or in the so called coming down of the inflation.
Only a fortnight ago, the World Inequality Lab had published a working paper titled “Measuring inflation Inequality in India”. The authors Rohan Bansal and Pachi Bansal found in their study that the volatility of inflation is higher for the poor vis-à-vis the rich households and has persistently remained higher for the poor household and concluded that the inequality of inflation and high volatility is anti-poor and requires immediate policy intervention.
Though CPI inflation measures the average cost of living in India based on the spending pattern of an average household, it does not take into account the differences in the spending patterns of the households with respect to the changes in price of goods and services, the paper said.
There are two kinds of inequality that exist among the poor and the rich with respect to inflation. First, inflation erodes the purchasing power of the poor more than the rich and second, the rate of inflation faced by the poor is different than the rich. The cost of inflation is particularly devastating for the poor. Even the governor of the Reserve Bank of India in his statement on 4 May, 2023 also noted that high inflation has “pronounced adverse effects on the poorer segments of the population by eroding their purchasing power”.
The authors said that in 2024, the bottom 5 per cent of the people faced 6.4 per cent headline inflation while top 5 per cent faced an inflation of 4.7 per cent only. Food inflation in 2024 was 9.5 per cent for the bottom 5 per cent while it was 6.4 per cent for the top 5 per cent. Such a glaring inflation inequality was found for every year since 2015, the year from which the data were examined, in the working paper.
The researchers have found pro-rich bias in the CPI food basket. The findings show significant distributional disparities, particularly in volatile staples like edible oils, vegetables, and pulses where poorer households face higher inflation for several years—highlighting the limitations of using an average CPI number to compute inflation.
Cereals constitute a substantial 19 per cent of the consumption basket for the poorest households, compared to just 4.2 per cent for the richest. Ordinarily, such a disparity in budget share can potentially expose poorer households to a higher risk of inflation inequality in cereals. The next two sub-groups that constitute the largest shares in the CPI basket of the poor include vegetables and oils and fats. Vegetables constitute 9.7 per cent of the poor’s basket whereas only3.2 per cent of the rich’s basket. Oils and fats comprise 4.8 per cent of the poor’s basket whereas 2.1 per cent of the rich basket. Pulses also exhibit a similar pattern with the poor having 3.9 per cent of the basket whereas for the rich it is 1.2 per cent. These categories contribute significantly to the poor’s consumption basket, suggesting that the average-based CPI may obscure real inflation pressures faced by poorer households in critical food items.
The paper argued that the CPI Food and Beverages index consistently understates the inflation faced by the poorest households, revealing a systemic pro-rich bias in inflation protection. In contrast, richer households consume more diversified food baskets. Since official CPI averages dilute these class-based differences, policies indexed to CPI (e.g., wages, subsidies) fail to keep pace with the real cost pressures on the poor, deepening inequality.
The analysis also reveals that headline CPI averages mask these distributional disparities, leading to a pro-rich bias in inflation measurement and protection. It confirms the presence of plutocratic bias in the Consumer Price Index (CPI)—that is, the index disproportionately reflects the consumption patterns of higher-spending households.
The analysis is constrained by the lack of latest consumption basket by CPI (the CPI basket is based on HCES 2011-12 and not 2022-23 or 2023-24), non-availability of data on consumption items provided under various government schemes like PMGKAY is not captured by CPI (these goods can be free or have zero prices, and thus result in overstating inflation, and methodological issues inherent to the CPI calculation (substitution bias as explained by Jorgenson).
The working paper has thus pointed out some of the serious concerns about India’s inflation data. Apart from that, the current inflation data reveal some other concerns. Housing inflation has increased from 3.06 per cent in April 2024 to 3.16 per cent in May 2025. Education inflation is almost stagnant which was 4.13 per cent last year but now is 4.12 per cent. Health inflation has increased from 4.25 to 4.34 per cent. Transport and communication inflation has increased from 3.67 per cent to 3.85 per cent.
India must address the real price rise problem faced by the common people rather than tampering CPI in favour of the rich, and to show it lower than the real inflation faced by the poor people. (IPA Service)
 Implementation Of 33 Per Cent Women Reservation To Take Place From 2029 Polls