By Dr. Gyan Pathak
Two reports brought out recently by Union Ministry of Statistics and Programme Implementation present puzzling data on employment and unemployment in 2024, and when read them together a doubly confusing scenario emerges regarding the ground realities. These two reports are – Key Employment Unemployment Indicators, PLFS, 2024 and Time Use in India, 2024.
On the basis of the Periodic Labour Force Survey (PLFS) Annual Report 2023-24 (July-June) and the samples collected between the July-September 2024, and October-December 2024, the Key Employment Unemployment Indicators for 2024 has concluded that unemployment rate has worsened on usual status basis, and brightened on current weekly status (CWS) basis compared to 2023.
On the usual status basis unemployment rate in 2023 was 3.1 per cent which rose to 3.2 per cent in 2024. During the same period unemployment rate fell from 5 per cent to 4.9 percent on CWS basis.
When one tries to understand this contrast in unemployment – one says it rose, and the other says it fell – in the light of performance of the India economy, it puzzles – as puzzling as the employment estimates on the basis of KLEMS data produced by Reserve Bank of India, which forms the PM Narendra Modi’s claim that India has been generating 2 crore jobs yearly.
RBI’s KLEMS data shows employment increased from 47.1 crore in 2014-15 to 47.3 crore in the year of demonetization (2016-17) when millions of MSMEs were either shut down or significantly scaled down production, to 56.6 crore in 2020-21 when entire economy was shut down due to COVID-19, and 57.8 crore when COVID-19 crisis worsened causing large scale economic shutdown in 2021-22. For 2022-23, its showed number of employed at 59.9 crore, and for 2023-24 at 64.3 crore.
More puzzling becomes the RBI data, when we see the GDP growth rates for the years when employment jumped. In 2014-15 GDP growth rate was 7.2 per cent, which grew to 8.1 per cent in 2016-17, fell to a negative (-)5.8 per cent in 2020-21, rose to 9.1 per cent in 2021-22.GDP growth rate has been falling since 2021-22 and now has been estimated likely to grow at only 6.5 per cent in 2024-25 which is four years low. In 2023-24 GDP growth rate was 8.2 per cent.
When economy has performed badly how the employment rose, both in the RBI and the other government data? There is no convincing answer. However, the latest PLFS key indicators for 2024 shows that unemployment rate fell on the basis of CWS, but rose on the basis of usual status. It presents another mystery – rise and fall both at a time?
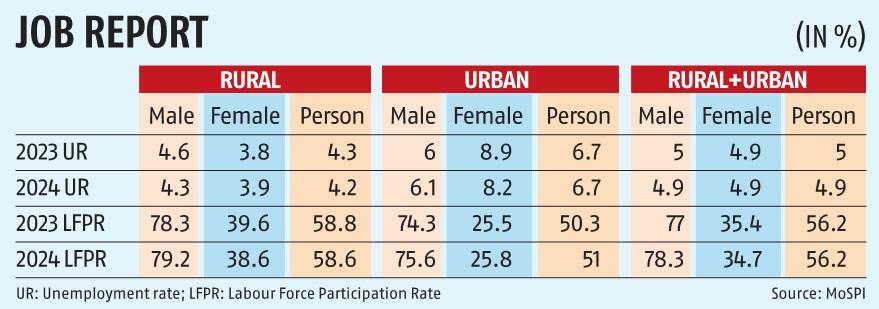
Puzzle continues in case of Labour Force Participation Rate (LFPR) also, which is the percentage of persons in labour force which included working or seeking or available for work in the population. LFPR was down marginally from 59.8 per cent in 2023 to 59.6 per cent, as per the data on usual status basis but it remained constant at 56.2 per cent. It was despite sharp fall in GDP growth rate in India from 8.2 per cent in 2023-24 to 6.7 per cent in the first quarter and 5.6 per cent in the second quarter of 2024-25.
Similar puzzling data has been published for Worker Population Ratio (WPR) which as the percentage of employed person in the population. On usual status basis it fell from 58 per cent in 2023 and to 57.7 per cent in 2024, but on CWS basis, it rose from 53.4 per cent to 53.5 per cent.
This puzzle on employment and unemployment becomes more problematic in solving when we take into account how the employed and unemployed persons are counted, such as unpaid household helps are counted employed, a person getting one hour of paid job in a week is counted employed, and those who out of frustration stop searching jobs and not counted as unemployed.
The second report “Time Use in India, 2024” on adds to the puzzle. It shows that only 35.3 per cent of people of 15-29 years of age were in employment and related activities in a day, 56.4 per cent were in unpaid domestic services for household members, 30 per cent were in unpaid caregiving services for household members, and 0.8 per cent in unpaid volunteer, trainee, and other unpaid works.
For the people between 15 and 59 years of age, 49.9 per cent people were engaged in employment and related activities, 61.7 per cent in unpaid domestic services for household members, 31.3 per cent in caregiving services for household members, and 1 per cent in unpaid volunteer, trainee and other unpaid works.
The LFPR and WPR data presents much higher percentages than the data given in the “Time Use in India, 2024” report. In 2024, the Time Use Report said, 49.9 per cent people of 15-59 age group people were in employment and related activities. LFPR for 2024 for 15 and above people was 59.6 per cent on the basis of usual status and 56.2 per cent on CWS basis. WPR for this group of people was 57.7 and 53.5 on respective bases.
What is then the real picture of employment and unemployment on the ground? The different sets of data on employment and unemployment when read with the GDP growth rate data produced by the government present different pictures. They either contradict each other or present a contrast. The government’s data on employment includes large number of unpaid employees, and its data on unemployment excludes large number unemployed who out of frustration due to not finding jobs have stopped searching for it. Low quality and unpaid jobs are additional problems. (IPA Service)
 Modi And Trump Don’t Just Blunder, They Also Outshine Each Other In Flip-Flops